|
|
|
|
The Geography of Alaska
Thinking Geographically
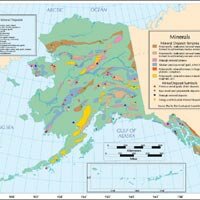 Figure G.1
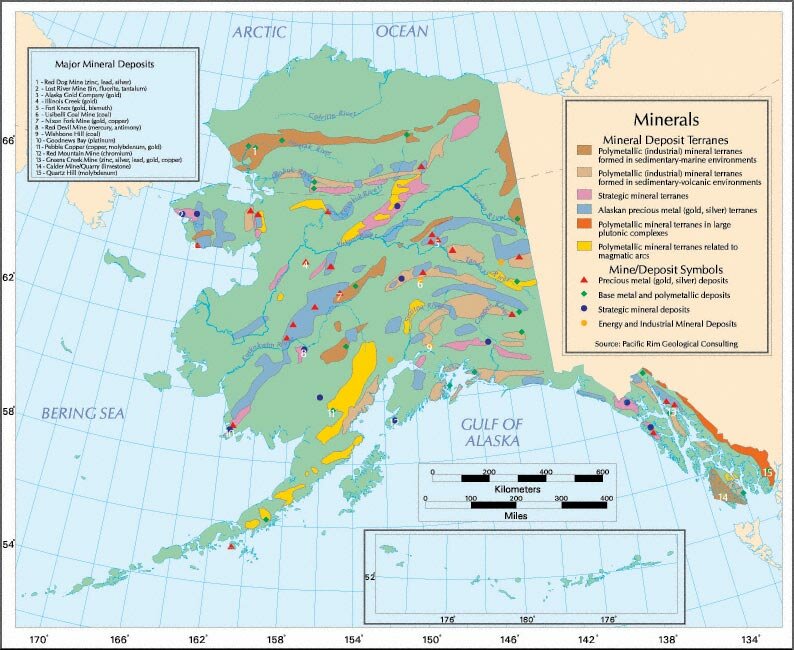
 ANILCA and Mineral Deposits
In a word, geography is the study of Where. Geographers study the spatial aspects of physical and human features on the earths surface. The roots of the word geography come from two Greek words meaning earth (geo) and describe (graphia) or the description of the earth. Geography also involves analyzing why things are distributed the way they are such as the location of forest lands in Alaska. Geography also studies how different features are related and the significance of those spatial relationships. An example of this type of study might focus on the comparative distribution of known mineral deposits and Alaska National Interest Lands (Figure G.1).
Description
Geographers use a number of ways to describe how things are distributed on the earths surface: writing, maps and graphs, and images. All are important and give different perspectives.
Whether it is a novelist setting the backdrop for a story or an explorer describing a new area, good written geographical description is necessary. Words convey images of scenes and activate our minds. Mystery writers often use detailed geographic descriptions of a geographic region to set the stage for their tale. Tony Hillerman has given evocative descriptions of the Navaho lands in his mystery stories. Similarly, Dana Stabenow and John Straley have provided geographic descriptions of Alaska in their mystery stories. Carefully written geographic and related scientific reports have been of great importance in exploration. In 1899, the Harriman Alaska Expedition traveled through coastal Alaska. The scientific reports of the expedition were contained in twelve volumes.
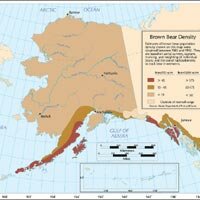 Figure G.2
 Alaska Bears
Maps give us a direct visual indication of how features are distributed. For example, the bear species Ursus arctos includes both brown bears and polar bears. The species is found throughout much of Alaska. However, a quick look at Figure G.2 shows that the distribution of the species is uneven. The highest densities are found in and near coastal areas bordering the Pacific Ocean. A closer look shows that the density drops dramatically in portions of Southeastern Alaska where Ursus arctos is not found at all south of Frederic Sound. This simple map says a lot about the distribution of the bear species. If you would like to test this out, try writing a more full description of the bears distribution than the brief synopsis given above.
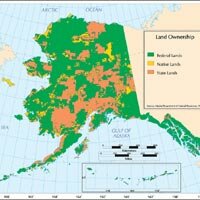 Figure G.3
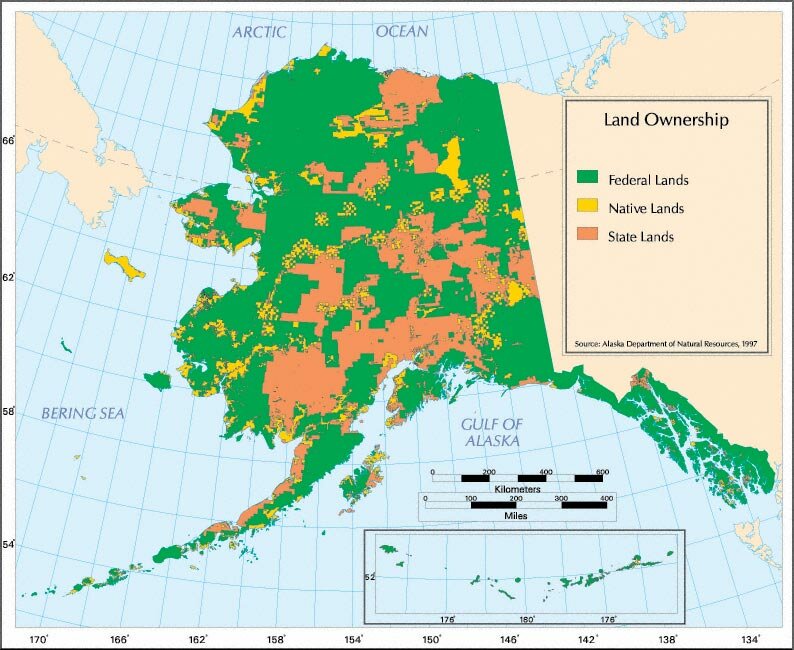
 Land Ownership in Alaska
Today Geographers and other specialists interested in the where of things use a variety of spatial tools. The cartographers map is now commonly constructed using a computer and digital data or Geography Information SystemsGIS. A vast amount of information, perhaps, 80% of all data collected, has a geographic component and can help us in our understanding and use of that information. Consider, for instance, the land ownership records of Alaska. The data is categorized by subunits of townships which were originally devised to simplify land acquisition as American settlement moved westward from the Appalachian Mountains. Figure G.3 shows the statewide pattern of ownership distribution. However, it does not show details for any particular area. With a GIS constructed map, these details are averaged out mathematically. A more detailed map of a specific area, in contrast, shows that the ownership patterns in some areas are actually fairly complex. Further, an even more detailed map would show small holdings by private land owners.
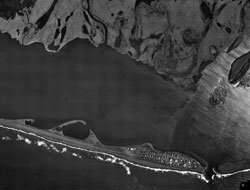 Figure G.4
 Aerial photograph of Kivalina, 1999.
Collection Name: Alaska Department of Community and Economic Development
Aerial photography and satellite imagery provide much different images. Consider the image in Figure G.4(forthcoming) which shows the community of Shishmaref. Without knowing much about the community, the image is difficult to interpret. However, to someone trained in studying these images, much can be learned about erosion from ocean waves and potential damage to the community for example.
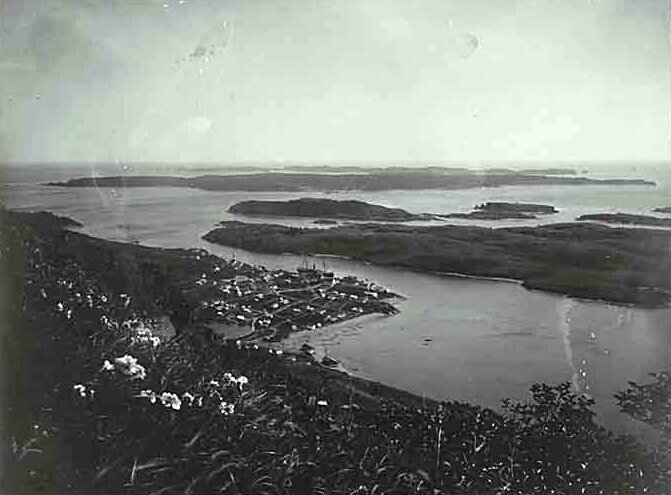
Cameras and art also provide us with excellent views of a landscape. The Harriman Alaska Expedition of 1899 included artists, poets, and a photographer. Their images of Alaska at the time have proven very valuable for an understanding of the changes in the physical and human environments over the last century. (See Figure G.5, an image from the original expedition.)
Analysis
In our desire to understand things, we often use inductive reasoning. We gather a lot of information on a subject and then reach a conclusion which can then be tested for application in other situations.
 Figure G.5
 Photograph of Kodiak from the Harriman Alaska Expedition
Collection Name: The Harriman Alaska Expedition: Chronicles and Souvenirs May to August 1899
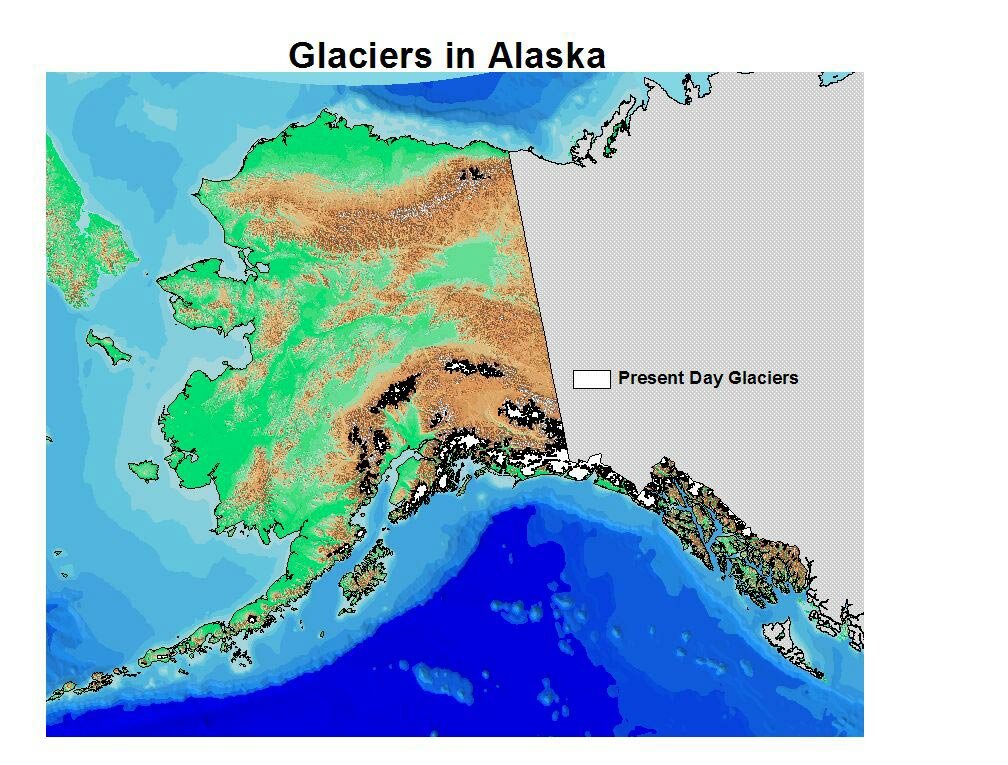
Testing a theory. We can use a general theory of glacier location to predict where glaciers might occur in Alaska. Glaciers need sufficient moisture and cold temperatures to not only build up but also to survive. A place that is very cold but has virtually no snowfall is not a good candidate for glacial formation. Northern Alaska certainly has the cold, but it does not have much precipitation. Alternatively, an area that has a lot of snow but too warm temperatures is also a poor candidate for glacial formation. Lowland areas of Southcentral Alaska have modest to high amounts of precipitation, but they get too warm for much of the year for glaciers to form. Mountainous areas of Southcentral and Southeastern Alaska, however, have both sufficient moisture and cold enough temperatures. A look at Figure PS.5 shows that, indeed, glaciers in Alaska are concentrated along coastal mountain areas of Southeastern and Southcentral Alaska.
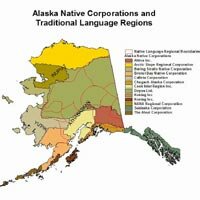 Figure G.6
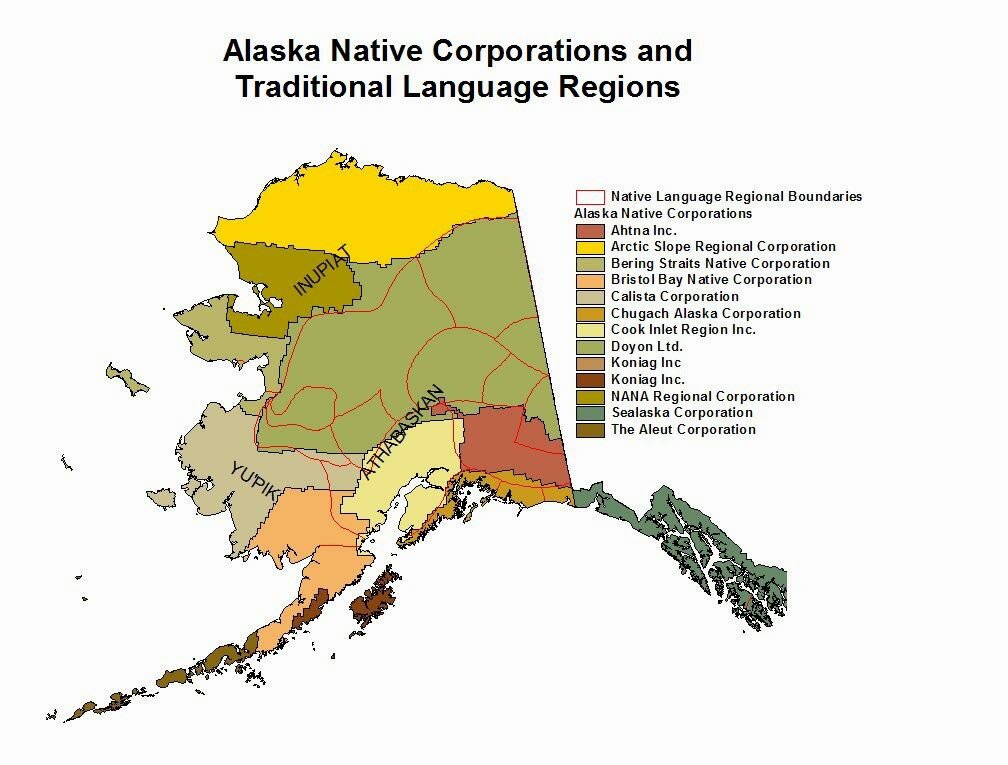
 Alaska Native Languages and Regional Corporations
Map Correlations. Use of GIS can help us in both testing theories about the distribution of features and in helping us to understand the geographic correlation of features. Suppose someone told you that the Alaska Native regional corporations were based strictly on language. How might you tell if that was true? One way would be to find out the historical information from the people who actually developed the regional corporation maps. That could take considerable research. You might first want to find out if the two themes (language and corporations) actually do have the same regions. To answer this, we can go to a composite GIS map. In Figure G.6 the two maps are layered with the corporation map below the language map. The Inupiat and Yupik language areas encompass several corporation regions while, in contrast, the Doyon Corporation encompasses several, but not all, of the Athabascan languages. The map correlation exercise gives you some clues to how corporation region boundaries were delimited, but, obviously, you need to do a lot more research.
|
|
|


